S.Bernuzzi 2019
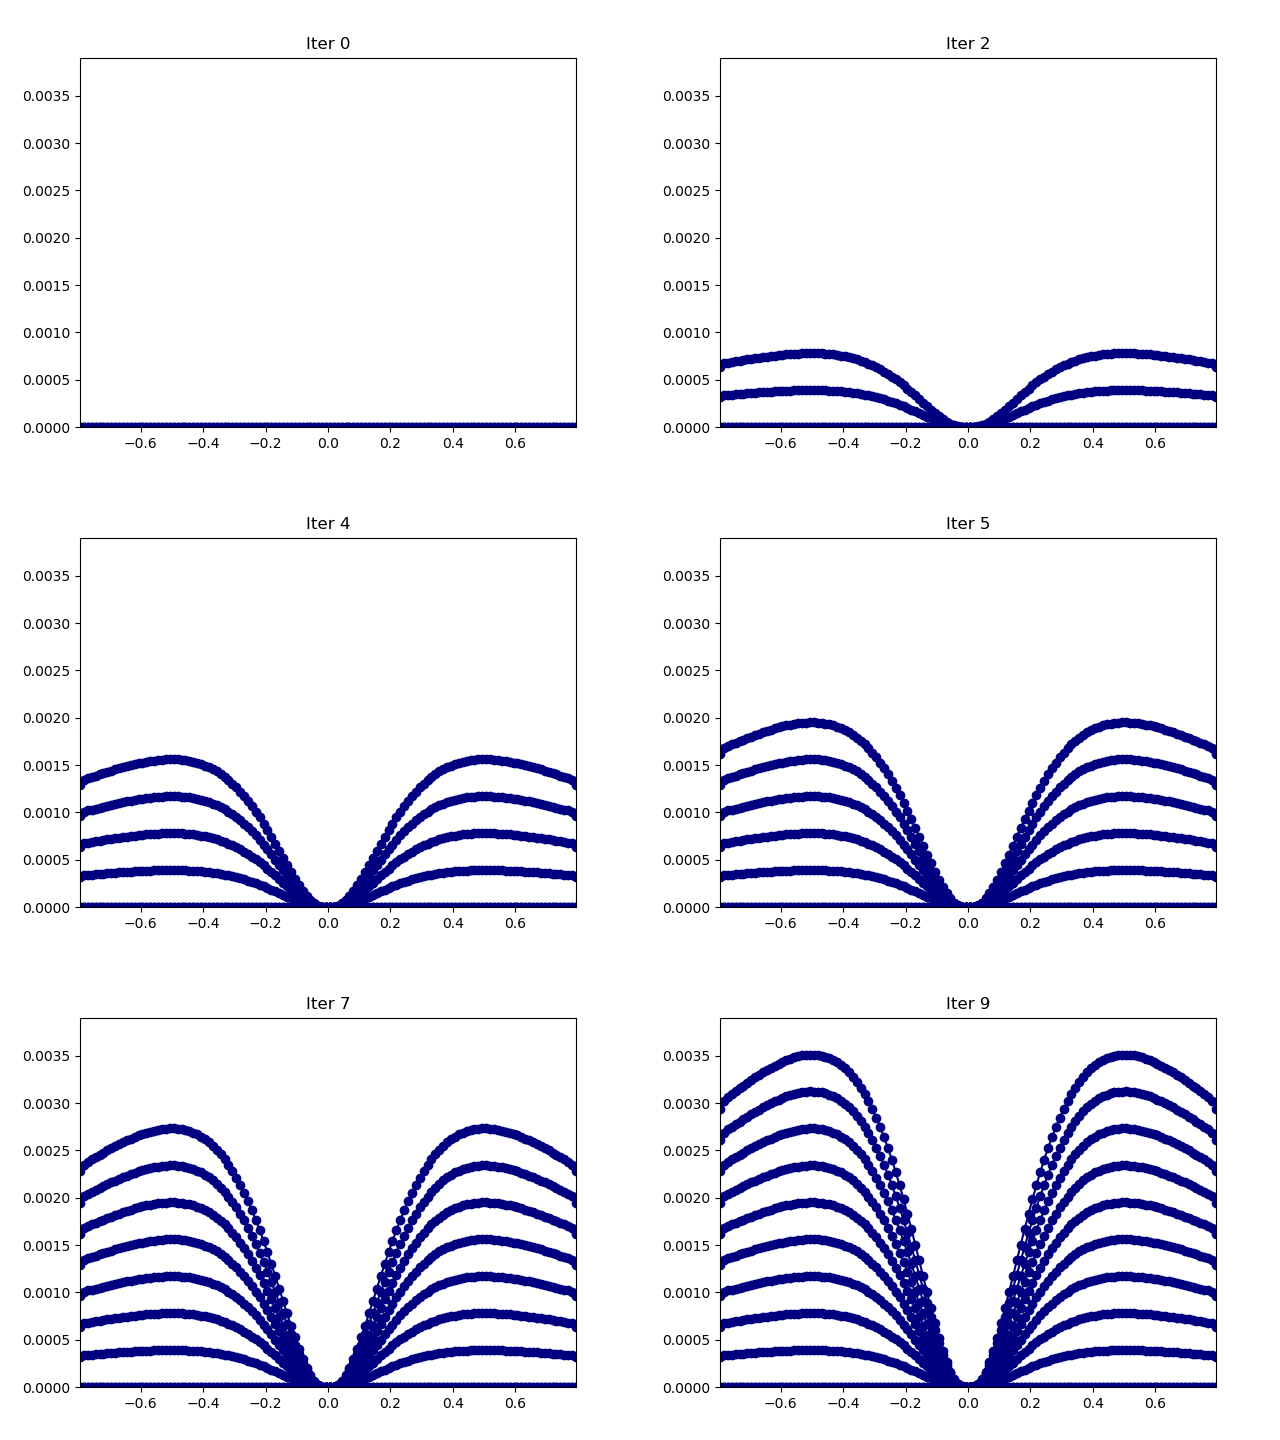
Pyg is a simple python3 program to plot & animates 1D data. Meant as a lightweight substitution for ygraph.

Data format:
"Time = 0.0
-0.7937500000000                0.0029384656523
-0.7812500000000                0.0030200425880
-0.7687500000000                0.0030619647295

"Time = 0.1
-0.7937500000000                0.0029384656523
-0.7812500000000                0.0030200425880
-0.7687500000000                0.0030619647295
Example:
$ ./yg.py -i data/Axx.xlThe code is distributed under MIT license and hosted at the git repo:
https://git.tpi.uni-jena.de/sbernuzzi/pygIt can be cloned with
$ git clone git@git.tpi.uni-jena.de:sbernuzzi/pyg.git$ ./yg.py --help
usage: yg.py [-h] -i FILE [FILE ...] [-s [TSTAMPS]] [-l HEADLS] [-t [TEST]]
[--all] [--save]
Plot/animate 1d output
optional arguments:
-h, --help show this help message and exit
-i FILE [FILE ...], --input FILE [FILE ...]
Inputfiles
-s [TSTAMPS], --timestamp [TSTAMPS]
Specify time stamp string
-l HEADLS, --headerlines HEADLS
Specify headerlines to skip
-t [TEST] Basic tests
--all Plot all times
--save Save framesExamples:
Different string for the time stamps: $ ./yg.py -i data/Axx_s.xl -s "#Time = (\d+\.\d+)"
Skip header lines at the top of the file: $ ./yg.py -i data/Axx_hl.xl -l 3